Extra-financial indicators
Extra-financial indicators
Environmental indicators
CARBON FOOTPRINT (SCOPE 1, 2 ET 3) IN TEQCO₂
| 2021 (reference year) | 2024 | 2025 | Change 2024/2025 | |
| Carbon footprint (scope 1,2 et 3) in teqCO₂ | 170,428 | 224,961 | 161,861 | -39,0% |
| In teqCO₂ | 2021 | 2024 | 2025 | Change 2021/2025 |
| Scope 1 | 226 | 194 | 217 | -4% |
| Scope 2 | 41 | 39 | 60 | +47% |
| Total | 267 | 233 | 277 | +3.9% |
| 2021 (reference year) | 2024 | 2025 | Change 2021/2024 | |
| Carbon intensity (in kg of CO₂ per k€ of turnover) | 304 | 255 | 180 | -40.8% |
| Carbon intensity (in kg of CO₂ per L of perfume) | 57.2 | 53.0 | 44.5 | -22.2% |
| In kWh | 2023 | 2024 | 2025 |
| Energy consumption | 1,696,084 | 1,682,325 | 1,988,735 |
| Total fossil fuel energy consumption (and % of total consumption) | 578,523 (34%) |
465,317 (28%) |
644,101 (32%) |
| Solar energy generated and used at Solférino | 4,881 | 6,841 | 7,500 |
| Proportion of renewable and recovered energy consumed | 9% | 11% | +13% |
The increase in energy consumption in 2025 is primarily attributable to the expansion of the reporting scope at the end of 2024. This change notably includes an adjacent building to the Group’s headquarters on Rue de Solférino, whose gas consumption significantly contributed to the year-on-year increase. For more information, please refer to the Group’s 2025 Annual Report, which provides detailed disclosures on these indicators and their evolution.
| 2023 | 2024 | 2025 | |
| Water consumption (in m³) | 1,301 | 1,014 | 2,830 |
| Water intensity (in m3 /€m of sales) | 1.629 | 1.152 | 3.147 |
| Water withdrawals (in m³) | 0 | 0 | 0 |
The increase in water consumption from direct operations in 2025 was primarily driven by a leak in the warehouse sprinkler system (fire protection system). In addition, the reporting scope was expanded to include water consumption data from the Solférino headquarters, which had not been available in previous reporting periods. For more information, please refer to the Group’s 2025 Annual Report, which provides detailed disclosures on these indicators and their evolution.
Scroll horizontally to view the figures.
Social indicators
| France scope (2022 and 2023) and Group scope for 2024 | 2023 | 2024 | 2025 |
| Number of losttime accidents | 1 | 0 | 1 |
| Number of losttime accidents while commuting | 0 | 2 | 0 |
| Frequency index (number of work accidents with lost time per million hours worked) | 1.87 | 0.00 | 1.62 |
| Severity rate (number of days of accidentrelated absence per thousand hours worked) | 0.010 | 0.000 | 0.013 |
| Number of occupational illnesses | 0 | 0 | 0 |
| 2023 | 2024 | 2025 | |
| Overall workforce gender parity (M/F) | M 26% – F 74% | M 25% – F 75% | M 23% – F 77% |
| M/F parity in management positions | M 39% – F 61% | M 37% – F 63% | M 34% – F 66% |
| M/F parity on the executive committee | M 73% – F 27% | M 58% – F 42% | M 50% – F 50% |
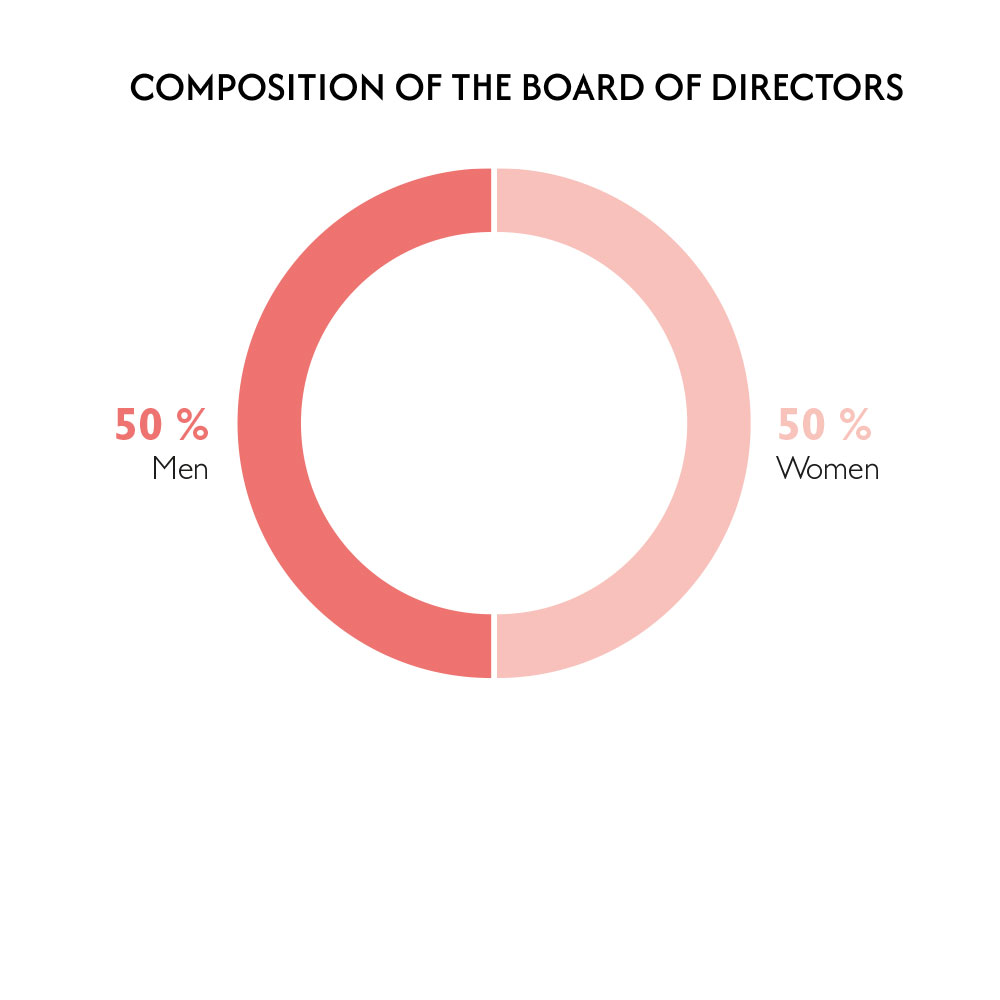
| M/F parity on the Board of Directors | M 50% – F 50% | M 45% – F 55% | M 50% – F 50% |
| Professional Equality Index score (France) | 84/100 | 85/100 | 85/100 |
Scroll horizontally to view the figures
Governance